"In my home there are few publications that we actually get hard copies of, but [Arms Control Today] is one and it's the only one my husband and I fight over who gets to read it first."
Plan A: How a Nuclear War Could Progress
July/August 2020
Seventy-five years ago, the United States tested the first nuclear weapon in New Mexico and then used one to destroy Hiroshima and another to destroy Nagasaki. As devastating as they were, those atomic bombs were small by today’s standards, each exploding with just a tenth of the explosive yield of typical warheads now deployed on missiles, submarines, and planes by a handful of countries. Fortunately, no nuclear weapons have been used in combat since the bombings in Japan, but the risk of nuclear war ebbed and flowed throughout the Cold War. It has been increasing in the past three years. The United States and Russia have abandoned long-standing nuclear arms control treaties, started to develop new kinds of nuclear weapons, and expanded the circumstances in which they might use nuclear weapons. However a nuclear exchange might start, it could quickly escalate from a local disaster into a global catastrophe.
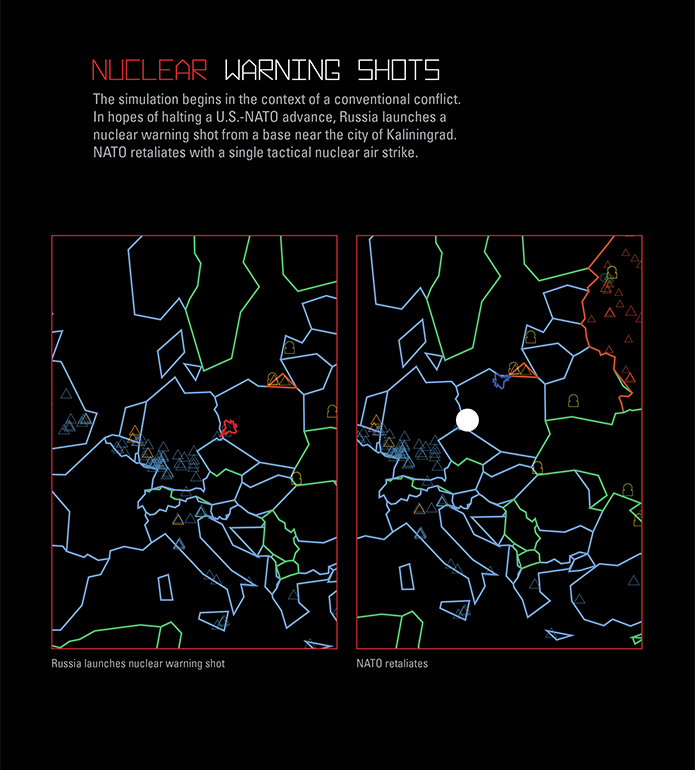
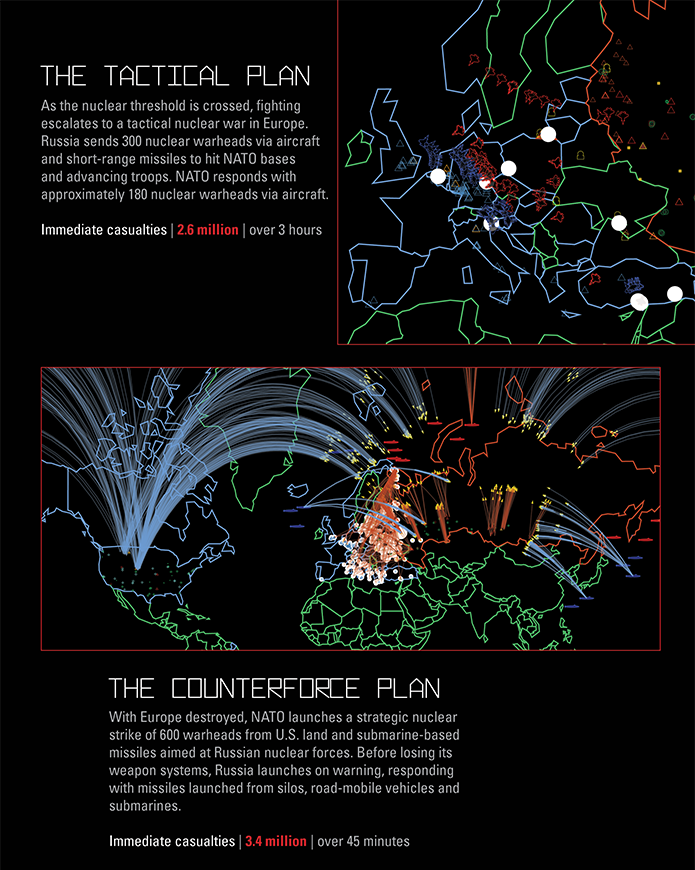
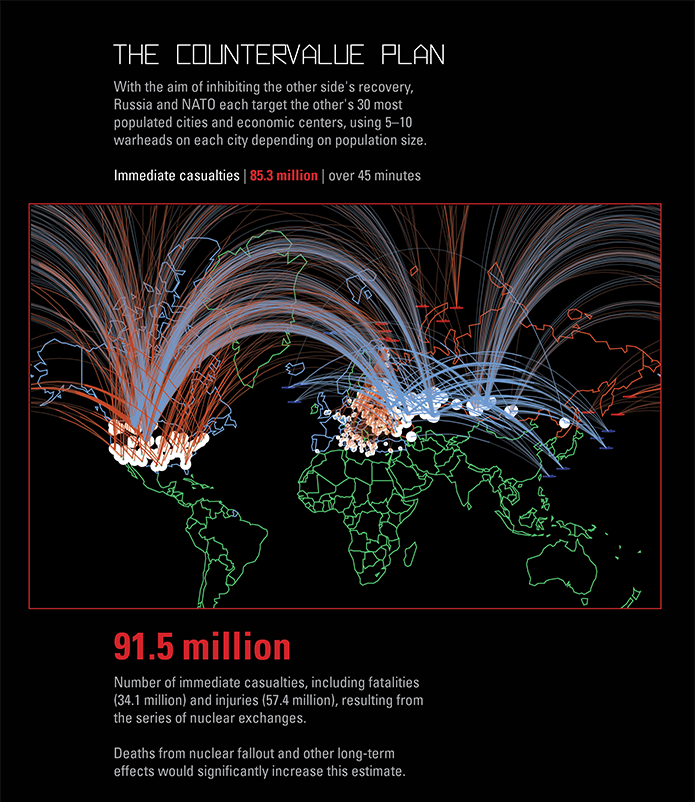
To illustrate how this could happen, Princeton University’s Program on Science & Global Security (SGS) developed a simulation that shows a plausible step-by-step escalation of nuclear war between the United States and Russia that starts in Europe. The images that follow are moments taken from the simulation’s four-minute video.
SGS researchers used independent assessments of current U.S. and Russian force postures, nuclear war plans, and nuclear weapons targets. The simulation was also supported by extensive data sets of the nuclear weapons currently deployed, weapon yields, and possible targets for particular weapons, as well as the order of battle estimating which weapons go to which targets in which order in which phase of the war to show the evolution of the nuclear conflict from tactical, to strategic by city-targeting phases. It is estimated that there would be more than 90 million people dead and injured within the first few hours of the conflict.
The immediate fatalities and casualties that would occur in each phase of the conflict are determined using data from NUKEMAP, an online tool to estimate casualties that was developed by Alex Wellerstein at the Stevens Institute of Technology. The actual fatalities would be significantly increased by deaths occurring from the collapse of medical systems, as well as nuclear fallout and other long-term effects, including a possible global-scale nuclear winter.
The simulation was developed by SGS researchers Tamara Patton, Moritz Kütt, and Alex Glaser, together with Bruce Blair, Zia Mian, Pavel Podvig, and Sharon Weiner, with sound by Jeff Snyder and graphics by Alex Wellerstein. It was originally prepared as part of the “Shadows and Ashes” exhibition at Princeton University’s Bernstein Gallery curated by Mary Hamill, the gallery director.


